A complete reference blog for Indian Government Employees

Showing posts with label Expected DA from Jan 2015. Show all posts

Tuesday, 4 November 2014

Expected DA from Jan 2015 – AICPIN Points for September Released – Remains Unchanged at 253

Expected-DA-jan-2015
Expected DA from Jan 2015 – AICPIN Points for September Released – Remains Unchanged at 253


One of the most important department functioning under the Central Government is the Labour Bureau. The department releases a number of important statistics and conducts surveys. In the year 1872, the department had successfully conducted the population census of the entire country. This census gave not only the count of number of persons, but also the number of gainfully employed. Since then every census has thrown useful data on workers in different industries and occupations every 10 years. The bureau also releases official information, economic indicators like Consumer Price Index Numbers for Industrial, Agricultural and Rural Labourers; wage rate indices and data on industrial relations etc. that are followed by a number of government departments.

One such indicator is the monthly Consumer Price Index Numbers (Industrial Workers 2001=100), which is used to calculate the Dearness Allowance for Central Government employees. Prices of 24 essential commodities (from rice to bathing soap) are observed in 78 cities all over the country in order to calculate the average index of CPI(IW).

It is based on these statistics that, once every six months, the Centre announces Dearness Allowance for its employees. Based on the AICPIN(All India Consumer Price Index Numbers) between January and June, and between July and December, the Finance Ministry decides the percentage of hike in Dearness allowance and Dearness Relief according to the recommendations of 6th CPC and informs the Government. The Centre makes its decision after discussing the recommendation during the cabinet meeting.

Now, ‘Expected DA from Jan 2015′ is the first installment of next year and only three months’ data have been collected as of now, for the Dearness Allowance. Accurate D.A percentage can be calculated only after the remaining 3 months’ AICPIN points are announced.

But, we believe that based on October’s AICPIN points, we can conclude if the next D.A hike is going to be for 6% or 7%.

The Dearness Allowance announcements since 2006 have been tabulated and presented, as additional information.

Year wise DA Calculation tables form 2006 to 2014…

DA-Calculation-for-Jan-2006           DA-Calculation-for-Jul-20061
DA-Calculation-for-Jan-2007          DA-Calculation-for-Jul-20071
DA-Calculation-for-Jan-2008          DA-Calculation-for-Jul-20081
DA-Calculation-for-Jan-2009         DA-Calculation-for-Jul-20091
DA-Calculation-for-Jan-2010         DA-Calculation-for-Jul-20101
DA-Calculation-for-Jan-2011         DA-Calculation-for-Jul-20111
DA-Calculation-for-Jan-2012         DA-Calculation-for-Jul-2012
DA-Calculation-for-Jan-2013         DA-Calculation-for-Jul-2013
DA-Calculation-for-Jan-2014        
DA-Calculation-for-Jul-2014 

Share:

Friday, 31 October 2014

Expected DA from Jan 2015 – AICPIN for the month of September 2014

Expected DA from Jan 2015 – AICPIN for the month of September 2014

No.5/1/2014- CPI
GOVERNMENT OF INDIA
MINISTRY OF LABOUR & EMPLOYMENT
LABOUR BUREAU
‘CLEREMONT’, SHIMLA-171004:
Dated the 31st October, 2014
Press Release

Consumer Price Index for Industrial Workers (CPI-IW) – September, 2014

The All-India CPI-IW for September, 2014 remained stationary at 253 (two hundred and fifty three). On 1-month percentage change, it remained stalic between August, 2014 and September, 2014 when compared with the rise of 0.42 per cent between the same two months a year ago.

The largest downward pressure to the change in current index came from Food group contributing (-) I .04 percentage points to the Lotal change. At item level, Fish Fresh, Poultry (Chicken). Chitlies Green. Ginger. Onion, Tomato, Brinal. French Beans. Lady’s Finger. Apple, Sugar, Medicine (Allopathie). Petrol. etc. are responsible for the decrease in index. However, this decrease was restricted to sore extent by Rice, Wheat Atta, Arhar Dal, Potato, Cauliflower. Tea (Readymade), Snack Saltish, Bidi, Cigarette, Electricity Charges, Cinema Charges, Toilet Soap. Tailoring charges. etc.. putting upward pressure on the index.

The year-on-year inflation measured by monthly CPI-1W stood at 6.30 per cent tbr September, 2014 as compared to 6.75 per cent for the previous month and 10.70 per cent during the corresponding month of the previous year. Similarly, the Food inflation stood at 6.46 per cent against 7.63 per cent ot’ the previous month and 13.36 per cent during the corresponding month of the pre ious year.

At centre level, Goa reported a decrease of 10 points followed by Nagpur (5 points). Among others, 4 points fall was observed in 6 centres. 3 points in 4 centres. 2 points in 9 centres and 1 point in 19 centres. On the contrary, Tripura recorded the maximum increase of 6 points followed by Lucknow & Jalpaiguri (4 points each) and Rourkela & Rangapara-Tezpur (3 points each). Among others, 2 points rise was registered in 8 centres and 1 point in 12 centres. Rest of the 13 centres’ indices remained stationary.

The indices of 37 centres are above and other 41 centres’ indices are below national average.

The next index of CPI-1W fut the month of October, 2014 will be released on Friday, 28 November. 2014.
The sanie will also be available on the office website www.labourbureau.gov.in
sd/-
(S.S.NEGI)
Director
Source: Labour Bureau
Share:

Wednesday, 10 September 2014

Expected DA from January 2015 – The Next Episode Begins…!

Expected DA from January 2015 – The Next Episode Begins…!
The Centre has announced a  hike of 7% Dearness Allowance and Dearness Relief for Central Government employees and Pensioners, with effect from July 2014 on 4th of this month. Soon, Finance Ministry will issue appropriate orders for payment of Dearness allowance to all. As and when orders are published by the Ministry of Finance, we will be posted in our website immediately.
According to the fluctuation of price index past six months from Jan to Jun 2014, the additional Dearness allowance has been arrived as 7% only. It seems there are a few employees who are unhappy with the single-digit number because until then they have been getting double-digit DA hikes.
The disappointment also reflects the high expectations that people have from the Modi government. Our readers have been raising a number of questions in this regard. While the previous Manmohan Singh government had twice given them DA hike of 10%, why has Modi government given them only 7% increase?
First of all, the ruling party at the Centre has no direct impact on the DA calculations. DA is calculated on the basis of AICPIN points, which are based on price rise.
The current system of DA calculations, which is being done as per the recommendations of the 6th Pay Commission, will come to an end after two more instalments (Jan 2015 and July 2015). Recommendations of the 7th Pay Commission are expected to come into effect from Jan 2016 onwards.
Now, the next episode begins…’Expected DA from January 2015′
It is highly unlikely that there will be a two-digit DA hike in the next two instalments (January 2015 and July 2015). Kindly keep in mind the fact that despite a 6 point increase of the AICPIN from 246 to 252 for the month of July 2014, there was hardly an impact. Even if it increases by 3 points over the next five months, the DA would increase to 9% only. It is impossible for AICPIN to constantly increase in future.
We believe that, under current circumstances, the next installment of additional Dearness allowance from Jan 2015 hike would only be about 6% or 7%.
 
We have analyzed the impact of CPI number on increasing DA and given below a table to express the same for your information…
Month/Year CPI(IW) 2001=100 Points
Increased
Total of
12 Months
12 Months
Average
% Increase
over 115.763
App. DA DA %  DA
Increased
in %
July 2014 252 6 2896 241.33 125.57 108.47 108 1.22

Month/Year CPI(IW) 2001=100 Points
Increased
Total of
12 Months
12 Months
Average
% Increase
over 115.763
App. DA DA %  DA
Increased
in %
Jun-13 231 3 2648 220.67 104.91 90.62 90 1.66
Jul-13 235 4 2671 222.58 106.82 92.28 92 1.66
Aug-13 237 2 2694 224.50 108.74 93.93 93 1.66
Sep-13 238 1 2717 226.42 110.66 95.59 95 1.66
Oct-13 241 3 2741 228.42 112.66 97.32 97 1.73
Nov-13 243 2 2766 230.50 114.74 99.12 99 1.80

Source: CGEN.in
Share:

Saturday, 30 August 2014

DA TABLE from 2008 to 2014 : DEARNESS ALLOWANCE TABLE

DA TABLE from 2008 to 2014
DEARNESS ALLOWANCE TABLE

2008

Month Base Year 2001=100 Total Average App. DA DA
May 139 1613 – – –
June 140 1623 135.25 16.84 16
July 143 1634 – – –
Aug 145 1646 – – –
Sep 146 1659 – – –
Oct 148 1673 – – –
Nov 148 1687 – – –
Dec 147 1700 141.67 22.38 22

2009

Jan 148 1714 – – –
Feb 148 1727 – – –
Mar 148 1738 – – –
Apr 150 1750 – – –
May 151 1762 – – –
June 153 1775 147.92 27.78 27
July 160 1792 149.33 29.00 —
Aug 162 1809 150.75 30.23 —
Sep 163 1826 152.17 31.45 —
Oct 165 1843 153.58 32.67 —
Nov 168 1863 155.25 34.11 —
Dec 169 1885 157.08 35.70 35

2010

Jan 172 1909 159.08 37.42 —
Feb 170 1931 160.92 39.01 —
Mar 170 1953 162.75 40.59 —
Apr 170 1973 164.42 42.03 —
May 172 1994 166.17 43.54 —
Jun 174 2015 167.92 40.05 45
July 178 2033 169.42 46.35 —
August 178 2049 170.75 47.50 —
Sep 179 2065 172.08 48.65 —
Oct 181 2081 173.42 49.81 —
Nov 182 2095 174.58 50.81 —
Dec 185 2111 175.92 51.97 51

2011

Jan 188 2127 177.25 53.12 —
Feb 185 2142 178.50 54.20 —
Mar 185 2157 179.75 55.28 —
Apr 186 2173 181.08 56.43 —
May 187 2188 182.33 57.51 —
Jun 189 2203 183.58 58.59 58
July 193 2218 184.83 59.67 —
August 194 2234 186.17 60.82 —
Sep 197 2252 187.67 62.12 —
Oct 198 2269 189.08 63.34 —
Nov 199 2286 190.50 64.56 —
Dec 197 2298 191.50 65.43 65

2012

Jan 198 2308 192.33 66.15 —
Feb 199 2322 193.50 67.15 —
Mar 201 2338 194.83 68.31 —
Apr 205 2357 196.42 69.67 —
May 206 2376 198.00 71.04 —
Jun 208 2395 199.58 72.41 72
Jul 212 2414 201.17 73.78 —
August 214 2434 202.83 75.22 —
Sep 215 2452 204.33 76.51 —
Oct 217 2471 205.92 77.88 —
Nov 218 2490 207.50 79.25 —
Dec 219 2512 209.33 80.83 80

2013

Jan 221 2535 211.25 82.49 —
Feb 223 2559 213.25 84.22 —
Mar 224 2582 215.17 85.87 —
Apr 226 2603 216.92 87.38 —
May 228 2625 218.75 88.97 —
Jun 231 2648 220.67 90.62 90
Jul 235 2671 222.58 92.28
Aug 237 2694 224.50 93.93
Sep 238 2717 226.42 95.59
Oct 241 2741 228.42 97.32
Nov 243 2766 230.50 99.12
Dec 239 2786 232.17 100.56 100

2014

Jan 237 2802 233.50 101.71
Feb 238 2817 234.75 102.79
Mar 239 2832 236.00 103.87
Apr 242 2848 237.33 105.02
May 244 2864 238.67 106.17
Jun 246 2879 239.92 107.25 107

Via: CGEN.in
Share:

AICPIN for July 2014 – 6 Points increased and stands at 252

AICPIN for July 2014 – 6 Points increased and stands at 252

No. 5/1/2014-CPI
GOVERNMENT OF INDIA
MINISTRY OF LABOUR & EMPLOYMENT
LABOUR BUREAU
`CLEREMONT’, SHIMLA-171004
DATED: the 29th August, 2014
Press Release

Consumer Price Index for Industrial Workers (CPI-IW) – July, 2014

The All-India CPI-IW for July, 2014 increased by 6 points and pegged at 252 (two hundred and fifty two). On 1-month percentage change, it increased by 2.44 per cent between June, 2014 and July, 2014 when compared with the rise of 1.73 per cent between the same two months a year ago.

The largest upward pressure to the change in current index came from Food group contributing 4.42 percentage points to the total change. The House Rent index further accentuated the overall index by 1.08 percentage points. At item level, Rice, Eggs, Milk, Onion, Chillies Green, Tomato, Potato and other Vegetables & Fruits, Sugar, Tea (Readymade), Pan Finished, Doctors’ Fee, College Fee, Petrol, Rail Fare, etc. are responsible for the increase in index. However, this increase was restricted to some extent by Wheat, Soft Coke, Medicine (Allopathic), etc., putting downward pressure on the index.

The year-on-year inflation measured by monthly CPI-IW stood at 7.23 per cent for July, 2014 as compared to 6.49 per cent for the previous month and 10.85 per cent during the corresponding month of the previous year. Similarly, the Food inflation stood at 8.11 per cent against 5.88 per cent of the previous month and 14.10 per cent during the corresponding month of the previous year.

At centre level, Nagpur recorded the maximum increase of 12 points followed by Ludhiana (10 points). Among others, 9 points rise was observed in 7 centres, 8 points in 3 centres, 7 points in 9 centres, 6 points in 23 centres, 5 points in 14 centres, 4 points in 10 centres, 3 points in 4 centres, 2 points in 4 centres and I point in 2 centres.

The indices of 35 centres are above and other 41 centres are below national average. The indices of Ernakulam and Varanasi are at par with all-India index.

The next index of CPI-IW for the month of August, 2014 will be released on Tuesday, 30 September, 2014. The same will also be available on the office website www.labourbureau.gov. in.
(S.S.NEGI)
DIRECTOR
Source: www.labourbureau.gov.in
Share:

Featured post

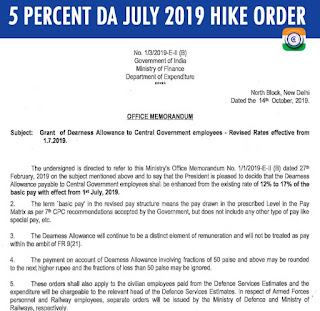
5 Percent DA July 2019 Hike Order - Grant of Dearness Allowance to Central Government employees

Grant of Dearness Allowance to Central Government employees 5 Percent DA July 2019 Hike Order  No. 1/3/2019-E- II (B) Government of...

Blog Archive

About The Author