A complete reference blog for Indian Government Employees

Tuesday, 23 July 2013

Fixation of Seniority/year of allotment Select List of 2009 Tamil Nadu Cadre.

Fixation of Seniority/year of allotment Select List of 2009 Tamil Nadu Cadre.


No. 14014/35/2004-A15-1
Government of India
Ministry of Personnel, Public Grievances & Pensions
(Department of Personnel & Training)


North Block, New Delhi
Dated the 18th July 2013


The Government of Tamil Nadu vide their letter dated 20.12.2012 had sent a proposalfor fixation of seniority of IAS officers appointed on promotion from SCS on the basis of inclusion of their names in the select list of 2009. These officers were appointed to IAS vide notification No. 14015/21/2009-AIS-1 dated 2 nd August, 2010. The Seniority /year of allotment of these officers was computed under Rule 3(3) (ii) of IAS (Regulation of Seniority), Rules 1987, and other relevant rules as amended from time to time.

2. Accordingly, seniority/year of allotment of promotee IAS officers of Tamil Nadu appointed on the basis of Select List of 2009 (prepare prior to Praveen Kumar ratio came to be implemented) has been computed .

3 As per Rule 4 of the IAS (Regulation of Seniority) Rules, 1987, the officer whose name has
been mentioned at SI. No. 1 of the select list of 2009 shall be placed below Shri T. P. Rajesh, the
junior most promotee IAS officer of 2004 batch and above Shri S. Nagarajan, the senior most
direct recruit IAS officer of 2005 batch of Tamil Nadu cadre.

3.1 As per Rule 4 of the IAS (Regulation of Seniority) Rules, 1987, the officer whose names Jaave_been mentioned at SI. No. 2 to 19 of the select list of 2009 shall be placed enblock below Shri M. Balaji, junior most RR IAS officer of 2005 batch and above Shri Hanish Chhabra, the senior most direct recruit IAS officer of 2006 batch of Tamil Nadu cadre.

4. This will supersede earlier order of even number dated 14th February 2013.

5. The order may be conveyed to the concerned officer.


(S.S. Shukla)
Under Secretary to the Government of India

Please refer the original PDF in the below link:
Source: http://ccis.nic.in/WriteReadData/CircularPortal/D2/D02ser/14014_35_2004-AIS-1-B.pdf
Share:

KV School Result Analysis for 10th and 12th standard

Class 10 and Class 12 examination results at
RESULTS AT THE SECONDARY (CLASS-X) AND SENIOR SECONDARY (CLASS-XII) LEVELS
Education schools I've Union's commitment to excellence in Class 10 and Class 12 examination results, I reflected. Over the years I CBSE Class 10 and Class 12 examinations conducted by All India Ost Ost results are well above.

The commitment of the Kendriya Vidyalayas to excellence in education is reflected in the results at the secondary (Class-X) and senior secondary (Class-XII) levels. Over the last few years, the average result of Kendriya Vidyalayas has been significantly above all India average in both the AISSCE (Class XII) and AISSE (Class X) examinations conducted by the Central Board of Secondary Education.
 
Close to 10 percent of the class-region offices / REGION WISE PASS PERCENTAGE FOR CLASS X
Sl No. /
S.NO
-Region office /
REGION
2007 2008 2009 2010 2011 2012 Variance /
VARIATION
Ost VS of the variance (99.49) / VARIATION WITH KVS AVERAGE (99.49)
1 Ahmedabad / Ahmedabad 97.87 97.16 96.32 96.11 99.68 99.48 -0.20 -0.01
2 Bengaluru / Bangalore 99.22 99.39 99.29 99.19 99.80 99.88 0.08 0.39
3 Bhopal / Bhopal 94.74 96.62 96.11 95.79 99.61 99.41 -0.20 -0.08
4 Bhubaneswar / Bhubaneshwar 96.44 96.70 97.15 96.92 98.60 99.57 0.97 0.08
5 Chandigarh / Chandigarh 97.34 96.99 97.53 96.54 99.44 99.39 -0.05 -0.10
6 Chennai / Chennai 98.44 98.89 99.42 99.12 99.94 99.81 -0.13 0.31
7 Deharadun / Dehradun 91.12 93.94 94.84 96.41 99.20 99.46 0.26 -0.03
8 Delhi / Delhi 93.16 94.88 95.82 96.51 99.15 99.51 0.36 0.02
9 Dibrugarh / Guwahati 95.29 93.17 95.87 96.91 97.75 99.52 1.77 0.03
10 Hyderabad / Hyderabad 96.88 97.94 97.82 98.00 99.51 99.87 0.36 0.38
11 Jabalpur / Jabalpur 94.22 94.94 93.12 93.97 99.10 99.19 0.09 -0.30
12 Jaipur / Jaipur 95.77 93.99 95.89 92.96 99.55 99.52 -0.03 0.03
13 J / Jammu 95.80 95.58 94.38 95.87 99.39 99.30 -0.09 -0.20
14 Calcutta / Kolkata 96.61 95.89 96.34 98.06 99.69 99.39 -0.30 -0.10
15 Lucknow / Lucknow 94.97 95.44 94.62 96.59 98.61 99.41 0.80 -0.07
16 Bombay / Mumbai 97.73 98.05 97.08 96.68 99.27 99.31 0.04 -0.19
17 Patna / Patna 94.78 95.19 97.02 95.62 98.76 99.59 0.83 0.09
18 Silchar / Silchar 95.89 93.59 96.34 98.01 97.54 99.88 1.34 -0.61
19 The VS (Mukyal) / KVS (HQ) 98.31 98.15 98.00 95.16 94.74 98.77 4.02 -0.73

Close to 12 percent of the class-region offices / REGION WISE PASS PERCENTAGE FOR CLASS XII

Sl No. /
S.NO
-Region office /
REGION
2007 2008 2009 2010 2011 2012 Variance /
VARIATION
Ost VS of the variance (94.15) / VARIATION WITH KVS AVERAGE (94.15)
1 Ahmedabad / Ahmedabad 93.20 90.73 89.80 88.79 90.48 91.93 1.45 -2.23
2 Bengaluru / Bangalore 98.27 97.14 96.68 97.02 95.00 96.24 1.24 2.09
3 Bhopal / Bhopal 93.66 91.83 92.11 92.39 91.83 93.34 1.51 -0.81
4 Bhubaneswar / Bhubaneshwar 91.74 90.02 91.10 90.10 93.28 92.33 -0.95 -1.82
5 Chandigarh / Chandigarh 94.47 92.88 94.82 94.86 94.75 94.93 0.18 0.78
6 Chennai / Chennai 97.75 94.85 94.18 97.51 97.58 97.21 -0.37 3.06
7 Deharadun / Dehradun 90.08 86.47 89.73 87.48 94.15 95.53 1.40 1.40
8 Delhi / Delhi 93.36 89.54 90.44 91.87 95.54 95.38 -0.16 1.24
9 Dibrugarh / Guwahati 92.98 92.07 91.11 93.54 94.68 95.44 0.76 1.29
10 Hyderabad / Hyderabad 92.58 92.65 90.69 93.58 95.71 97.45 1.74 3.30
11 Jabalpur / Jabalpur 90.77 89.69 87.64 85.52 88.75 90.89 2.14 -3.26
12 Jaipur / Jaipur 92.66 87.81 92.92 90.99 90.80 92.79 1.99 -1.36
13 J / Jammu 92.74 90.69 86.39 86.00 91.10 88.43 -2.67 -5.72
14 Calcutta / Kolkata 92.83 90.80 92.34 91.03 93.10 94.02 0.92 -0.13
15 Lucknow / Lucknow 92.80 92.38 92.54 90.39 93.92 93.58 -0.34 -0.57
16 Bombay / Mumbai 95.42 93.92 90.69 90.67 91.90 95.16 3.26 1.01
17 Patna / Patna 93.09 90.30 90.42 88.48 92.86 94.43 1.57 0.28
18 Silchar / Silchar 83.04 85.61 87.40 89.33 92.09 92.20 0.11 -1.95
19 The VS (Mukyal) / KVS (HQ) 85.96 92.98 91.38 89.36 91.38 98.18 6.80 4.03
Comparative test results of Class 10 / COMPARATIVE RESULT ANALYSIS - CLASS X

2006 2007 2008 2009 2010 2011 2012
Central School / Kendriya Vidyalayas 90.63 95.64 96.07 96.35 96.64 99.21 99.49
Upstart Vidyaly / Navodaya Vidyalayas 91.13 96.41 97.54 97.84 98.72 99.48 99.58
Free Vidyaly / Independent Schools 85.94 91.81 91.77 91.89 91.79 98.75 99.20
Total (CBSE) / Total (CBSE) 77.16 84.44 87.08 88.84 89.28 98.75 * 98.19
* Provisional


Comparative test results of Class 12 / COMPARATIVE RESULT ANALYSIS - CLASS XII

2006 2007 2008 2009 2010 2011 2012
Central School / Kendriya Vidyalayas 92.89 93.14 91.00 91.32 91.13 93.42 94.15
Upstart Vidyaly / Navodaya Vidyalayas 90.24 90.11 92.44 94.09 95.31 96.89 95.96
Free Vidyaly / Independent Schools 82.35 82.29 81.68 80.94 79.42 81.63 80.11
Total (CBSE) / Total (CBSE) 79.55 80.64 80.91 81.00 79.87 81.71 80.19
Academic Year /
Academic Year
The. Pt. Ost (%) (Class 10) /
All India Average (%) (Class X)
The V S Ost (%) (Class 10) /
KVS Average (%) (Class X)
The. Pt. Ost (%) (Class 12) /
All India Average (%) (Class XII)
The V S Ost (%) (Class 12) /
KVS Average (%) (Class XII)
1994 69.43 85.86 73.98 84.19
1995 63.38 77.75 70.90 84.19
1996 64.19 77.02 70.90 80.22
1997 64.27 79.11 78.50 83.31
1998 63.20 76.80 72.60 79.90
1999 64.40 77.90 74.68 83.10
2000 65.40 78.00 76.35 83.00
2001 66.60 81.08 75.02 83.70
2002 69.53 85.57 75.20 86.44
2003 68.00 84.60 73.60 88.70
2004 76.60 90.44 80.40 92.78
2005 74.60 89.95 77.80 92.47
2006 77.16 90.63 79.55 92.89
2007 84.44 95.65 80.64 93.14
2008 87.08 96.07 80.91 91.00
2009 88.83 96.35 81.00 91.32
2010 89.28 96.64 79.87 91.13
2011 99.75 * 99.21 81.71 93.42
2012 98.19 99.49 80.19 94.15
* Provisional


Gunwattanusar Class 10 Examination Results / Qualitative Result Analysis - Class X
YEAR / YEAR Insert / APPEAR Nearby% / PASS%
Nearby points with group% /% AGE OF PASSOUTS WITH AGGREGATE MARKS
60% more /
60% and above
75% more /
75% and above
90% more /
90% and above
2005 60 063 89.85 61.20 25.80 2.42
2006 65 074 90.63 67.61 30.26 3.51
2007 68 749 95.64 68.51 31.70 4.16
2008 75 987 96.07 63.88 22.40 4.60
2009 78 328 96.35 67.41 35.12 6.46
YEAR / YEAR Insert / APPEAR Nearby% / PASS% Vidhyarthion number of subjects and grade I received the 5% /
Nos. and% age of students secured Grade in all 5 subjects
CGPA 8-9 CGPA 9-10 CGPA = 10
2010 80 995 96.64 0.13 0.23% 1.49
2011 89 230 99.21 1.57 2.55 5.23
2012 89 725 99.49 19.74 16.41 6.56

Gunwattanusar Class 12 Examination Results / Qualitative Result Analysis - Class XII

YEAR / YEAR Insert / APPEAR Nearby% / PASS%
Nearby points with group% /% AGE OF PASSOUTS WITH AGGREGATE MARKS
60% and above 75% and above 90% and above
2005 42 429 92.47 73.60 19.37 0.83
2006 47 043 92.89 75.09 23.49 1.25
2007 50,000 93.14 78.47 28.89 1.88
2008 55 590 91.00 76.19 24.13 1.53
2009 57 424 91.32 76.30 26.26 2.50
2010 60 082 91.13 75.70 25.11 2.45
2011 63 256 93.42 74.12 26.43 2.88
2012 61 824 94.15 78.53 32.80 4.29

Source: http://www.kvsangathan.nic.in/ResultAnalysis.htm
Share:

Prime Ministers of India from 1947-2012

A List of Indian Prime Ministers (1947-2012)


No
Name
Entered office
Left office
Date of Birth
Date of Death
Political party
1
Jawahar Lal Nehru
15-Aug-1947
27-May-1964
14-Nov-1889
27-May-1964
Indian NationalCongress
2
Gulzarilal Nanda
27-May-1964
9 June 1964 *
4 July 1898
15-Jan-1998
Indian NationalCongress
3
Lal Bahadur Shastri
09-Jun-1964
11-Jan-1966
02-Oct-1904
11-Jan-1966
Indian NationalCongress
4
Gulzarilal Nanda
11-Jan-1966
24 January 1966   *
4-July-1898
15-Jan-1998
Indian NationalCongress
5
Indira Gandhi
24-Jan-1966
24-Mar-1977
19-Nov-1917
31-Oct-1984
Indian NationalCongress
6
Morarji Desai
24-Mar-1977
28-Jul-1979
29-Feb-1896
10-Apr-1995
Janata Party
7
Charan Singh
28-Jul-1979
14-Jan-1980
23-Dec-1902
29-May-1987
Janata Party
8
Indira Gandhi
14-Jan-1980
31-Oct-1984
19-Nov-1917
31-Oct-1984
Indian NationalCongress
9
Rajiv Gandhi
31-Oct-1984
02-Dec-1989
20-Aug-1944
21-May-1991
Indian National Congress(Indira)
10
Vishwanath PratapSingh
02-Dec-1989
10-Nov-1990
25-Jun-1931
27-Nov-2008
Janata Dal
11
Chandra Shekhar
10-Nov-1990
21-Jun-1991
01-Jul-1927
08-Jul-2007
Samajwadi JanataParty
12
P. V. Narasimha Rao
21-Jun-1991
16-May-1996
28-Jun-1921
23-Dec-2004
Indian NationalCongress
13
Atal Bihari Vajpayee
16-May-1996
01-Jun-1996
25-Dec-1924
Alive
Bharatiya JanataParty
14
H. D. Deve Gowda
01-Jun-1996
21-Apr-1997
18-May-1933
Alive
Janata Dal
15
Inder Kumar Gujral
21-Apr-1997
19-Mar-1998
04-Dec-1919
Alive
Janata Dal
16
Atal Bihari Vajpayee
19-Mar-1998
22-May-2004
25-Dec-1924
Alive
Bharatiya JanataParty
17
Dr. Manmohan   Singh
22-May-2004
Incumbent
26-Sep-1932
Alive


Prime Ministers of India 1947 - 2012

http://sapost.blogspot.in/2012/07/list-of-indian-prime-ministers-1947.html
Share:

Featured post

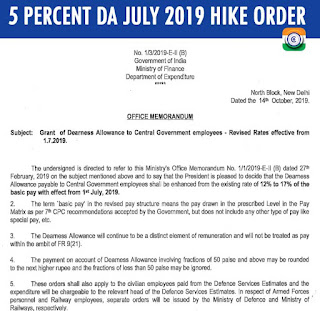
5 Percent DA July 2019 Hike Order - Grant of Dearness Allowance to Central Government employees

Grant of Dearness Allowance to Central Government employees 5 Percent DA July 2019 Hike Order  No. 1/3/2019-E- II (B) Government of...

Blog Archive

About The Author